

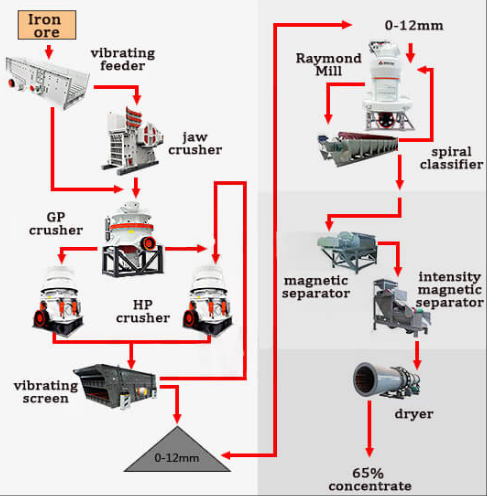
Iron Ore Processing Flow Chart
- High-Crushing Ratio: Our heavy-duty jaw and cone crushers are designed specifically for the high hardness of iron ore, ensuring more “fine” material enters the grinding stage.
- Intelligent Automation: Our HPT series cone crushers feature automatic clearing and one-touch setting adjustments, reducing manual labor and downtime.
- Energy-Efficient Grinding: Liming ball mills and vertical mills are engineered to reach the required liberation size with significantly lower power-per-ton metrics.
- Durability in Abrasive Conditions: We use proprietary high-manganese steel and alloy linings to extend the life of wear parts in harsh iron mining environments.
The Complexity of Iron Ore Beneficiation
Iron ore is the backbone of the global steel industry, but extracting high-grade concentrate from raw hematite or magnetite is a high-stakes engineering challenge. Mine managers often struggle with inefficient iron ore processing flow charts that lead to excessive energy consumption, high wear-part costs, and low metal recovery rates.
Whether you are dealing with magnetite’s magnetic properties or the complex structure of hematite, the efficiency of your iron ore crushing plant determines your project’s profitability. Liming Heavy Industry provides world-class crushing and grinding solutions designed to streamline your flow chart and reduce operational overhead.
Why Liming Machinery Leads the Iron Ore Sector
Our engineers have optimized thousands of mining sites globally. When you integrate Liming equipment into your iron ore flow chart, you benefit from:
Step-by-Step: The Modern Iron Ore Processing Flow Chart
A standard high-efficiency plant typically follows these three critical stages:
Stage 1: Primary and Secondary Crushing
The goal is to reduce the run-of-mine (ROM) ore to a manageable size. For iron ore, we typically utilize a PEW European Jaw Crusher for primary reduction, followed by an HST or HPT Hydraulic Cone Crusher. This “crush more, grind less” approach is key to energy saving.
Stage 2: Fine Grinding and Liberation
To separate the iron minerals from the gangue, the ore must be ground into a fine powder. Liming’s high-capacity ball mills ensure that the iron particles are fully liberated for the subsequent separation stage.
Stage 3: Separation and Concentration
Depending on the ore type, this involves magnetic separation (for magnetite) or gravity/flotation (for hematite). Our flow charts ensure that the feed size to the separators is perfectly consistent, maximizing the grade of the final concentrate.
Technical Solution Comparison: Efficiency Matters
Compare how Liming’s optimized iron ore solutions perform against traditional configurations:
| Process Parameter | Standard Flow Chart | Liming Optimized Flow Chart |
|---|---|---|
| Final Product Size (Crushing) | 0-25mm | 0-12mm (Ultra-fine) |
| Grinding Energy Consum. | Baseline (100%) | Reduced by 15-20% |
| Wear Part Lifespan | Standard Castings | High-Chromium Alloy (30% Longer) |
| Operational Stability | Manual Monitoring | PLC Intelligent Control |
Custom Flow Chart Design for Your Mine
No two iron ore deposits are the same. Liming Heavy Industry provides custom-tailored iron ore processing flow charts based on your specific mineralogy reports. We offer site visits, foundation drawing design, and full-scale technician training to ensure your plant reaches its rated capacity on day one.
Optimizing your iron ore processing flow chart is the most effective way to lower your cost-per-ton. By choosing high-performance crushing and grinding equipment from Liming Heavy Industry, you ensure high recovery rates and long-term mechanical reliability.